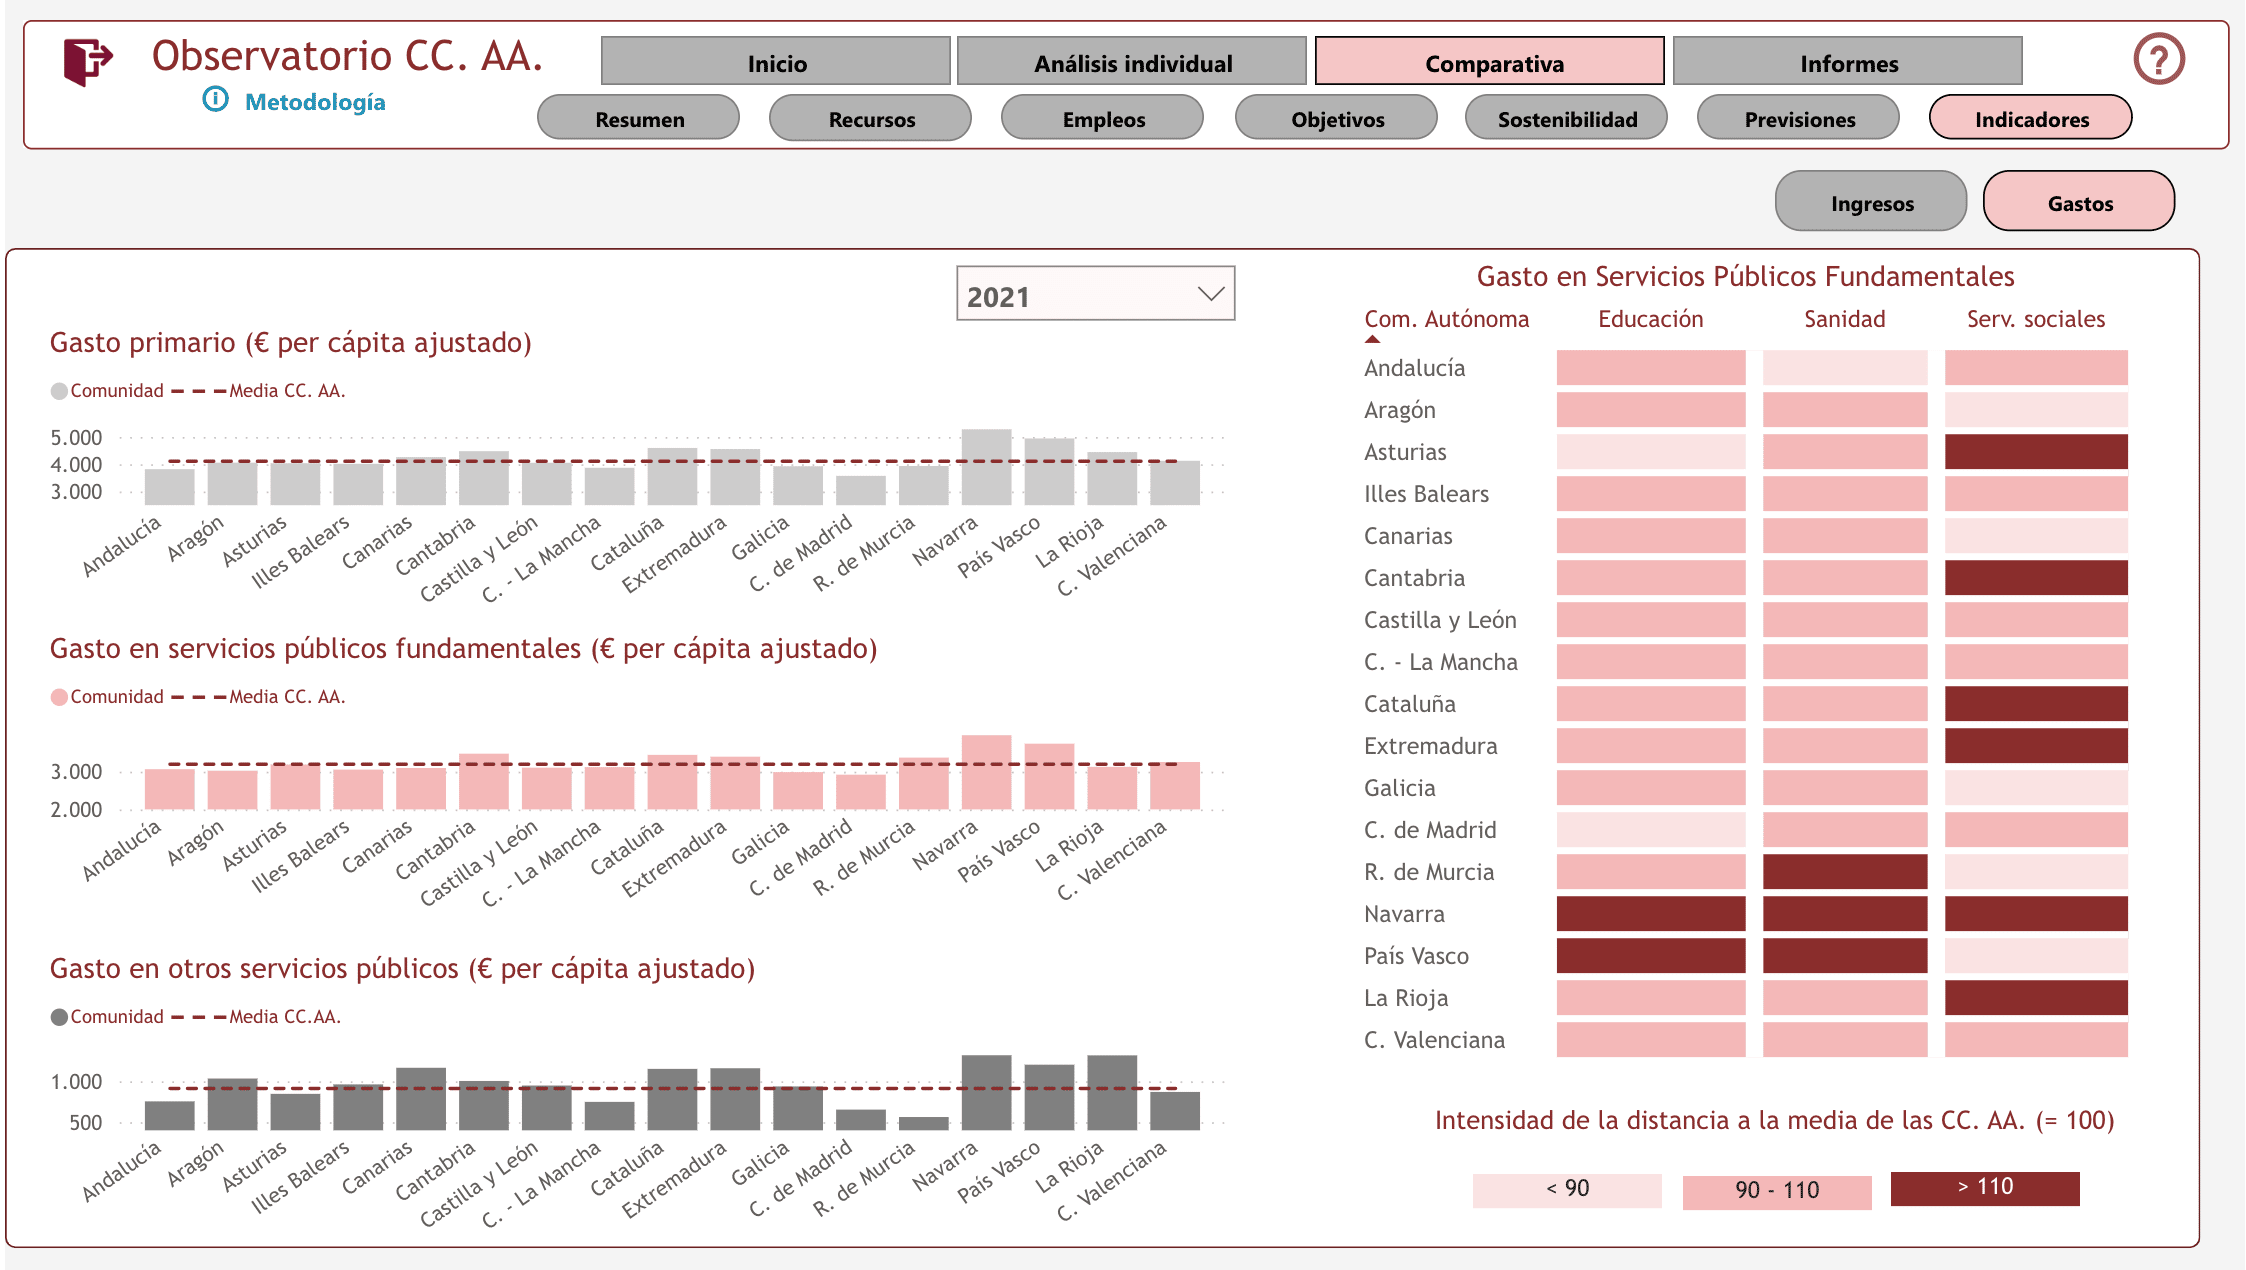
- The new version of AIReF’s Autonomous Regions Observatory includes a primary expenditure indicator and a breakdown into key public services such as healthcare, education and social services
- As regards revenue, it includes indicators that measure the use of the tax capacity of the ARs and indicators on homogeneous financing per capita received from the Financing System
- This version of the Monitor Tool makes it possible to compare healthcare spending in different regions and whether they have used their tax capacity to raise or lower taxes
The Independent Authority for Fiscal Responsibility (AIReF) has updated its Autonomous Region Observatory with new expenditure and revenue indicators that make it possible to determine the position of each region in relation to the others with the same powers. Until now, the Monitor Tool has directly exploited the National Accounting data, without taking into account the differences in powers or the different forms of management of the powers of the ARs. The new version allows variables to be compared as properly homogenised series have been built.
The Autonomous Region Monitor Tool is an interactive tool that offers an integrated overview of the economic and financial situation of the Autonomous Region. It allows an in-depth analysis of the situation of an Autonomou Region through the evolution of variables such as deficit, debt, GDP, revenue and expenditure over recent years. In addition, future forecasts of these variables can be consulted, comparisons can be made between Autonomous Region and the reports and documents prepared by AIReF for each region can be downloaded.
In this update, descriptive indicators of the relative position of the Autonomous Region in expenditure and revenue have been included. The expenditure indicators determine, per adjusted inhabitant, the expenditure of each region in homogeneous terms and its position with respect to the average. The Observatory includes a primary expenditure indicator, which measures the total expenditure of each region net of interest per adjusted inhabitant and is broken down into: expenditure on key public services (healthcare, education and social services) and other expenditure.
With regard to the information previously available, the Observatory adjusts the expenditure in National Accounting terms by removing interest and spending on powers that are not common to all Public Administrations, and distributes the transfers to the Local Government (LGs) and eliminates non-recurring operations, such as court rulings.
On the revenue side, the Monitor Tool includes indicators that determine the homogeneous financing per capita provided by the Regional Financing System (RFS) and measure the exercising of taxation capacity. Specifically, three revenue indicators are offered: the financing of the system in euros per adjusted inhabitant; the regulatory capacity exercised upwards by each region, both their own and transferred taxes, and as a percentage of regional GDP; and tax benefits as a percentage of GDP: it quantifies the tax benefits applied by the Autonomous Region on transferred taxes.
The Observatory makes it possible to see the overview of a specific year for these indicators in each Autonomous Region and the evolution over the years. In addition, the Observatory makes it possible to compare the evolution of these expenditure and revenue indicators in the different Autonomous Region and in different years or the average of a period according to the selection made by the user.
Direct access to the Autonomous Regions Interactive Observatory


